
1. Data in LIFEGENMON
In forest genetic monitoring we are dealing with many different data, e.g. genetic, phenological, meteorological and other field data. To ensure the integrity of data from many different sources, the raw data is stored in a relational database before analysis. A database allows us to access, manage, standardise and afterwards analyse data from multiple sources.
In forest genetic monitoring Three indicators, (1) Selection, (2) Genetic variation, and (3) Gene flow/Mating system, are monitored with a series of verifiers. For this purpose, field, laboratory and molecular marker data must be collected/produced and analysed to regularly evaluate the verifiers for the above three indicators.When analysing the data, we look for temporal changes in genetic variation, phenology (bud-break, senescence, flowering and fructification), natural regeneration abundance, etc.
The observed changes can provide us with important information about forest health and help us identify potentially harmful changes in forest adaptive capacity. The information can also be used to take action and implement management actions when changes are severe.
2. Examples of data and what it can be used for
2.1 Phenology
From the raw phenological data, we can calculate and graph the average onset of a particular phenological phase, e.g. the onset of different stages of senescence, and compare between years (Fig. 1). When plotted simultaneously with meteorological data, we can determine whether the course of phenology follows the temperature curve.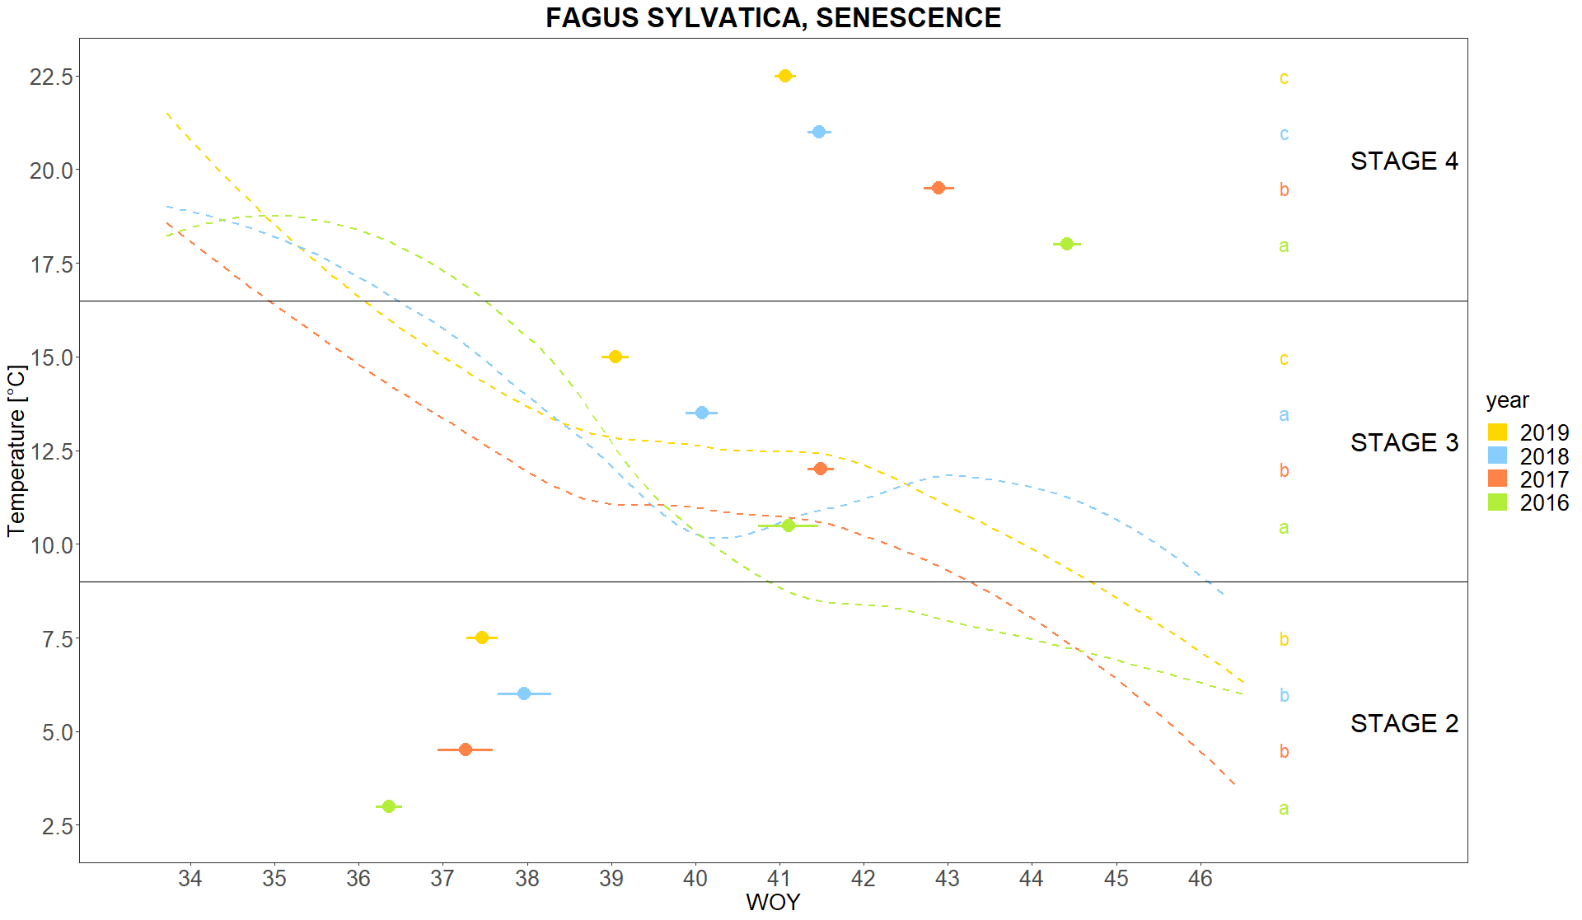
Fig. 1: Comparison of senescence events between 2016-2019 in Fagus sylvatica (Slovenia).
Raw phenological data contain information on the presence, frequency, and timing of flowering and fructification. Data on the intensity of flowering tell us how much fructification to expect. For species that do not flower every year, raw phenological data help us predict when to expect the next fructification.
Useful information that can also be obtained from raw phenological data is which trees will sprout and flower later in the spring (Fig. 2). This knowledge benefits us when selecting trees from which to collect seed, when we want to choose genotypes that flower late and are consequently less susceptible to spring frosts.
Fig. 2: Graphical representation of bud-break in 2019 for Fagus sylvatica trees in Slovenia.
2.2 Genetic raw data
The next big data set produced in LIFEGENMON is genetic data. The raw data includes records of 11/11 SSR and 163/212 SNP markers for Fagus sylvatica L. and Abies alba Mill./Abies borisii-regis Mafft. respectively from 3 partner countries: Germany, Greece and Slovenia. The data allow the calculation of many different verifiers from the ‘Genetic variation’ and ‘Gene flow / Mating system’ indicator sets, e.g. allele frequencies, allelic richness, inbreeding coefficient, effective population size, gene flow, actual inbreeding rate and others. The calculated values of these verifiers give us an insight into the genetic characteristics of the selected population (Table 1). By monitoring the genetic indicators and their verifiers on a temporal scale, we can see if the genetic characteristics of a target population are maintained or reduced due to changing environmental conditions. When comparing data at a temporal scale, the statistically significant and/or critical difference from temporal reference points is preferred, but it should be noted that such a critical difference is itself a threshold. This has important implications for actions that can be taken (Table 2).
Table 1: Parameters of genetic variation calculated based on SNP markers for Fagus sylvatica in 3 countries (Germany, Slovenia and Greece).

Table 2: Levels of critical difference among temporal evaluations, levels of response and advised action (ssd: statistically significant differences).

To gain insight into patterns of forest tree recruitment, seedling and seed dispersal kernels can be examined in conjunction with temporal variation in effective reproductive success (Fig. 3 and Fig. 4). Male and female relative reproductive success (the number of offspring produced by one individual compared to another individual or the population average) is widely accepted as a key criterion for describing sex variation within and among populations and its evolutionary consequences. Studies such as this give us insight into evolutionary processes and may be important for drawing conclusions about observed changes in reproductive value, as defined in forest genetic monitoring. In addition, this could also have implications in the context of forest management, as felling trees that have high relative fecundity could have an impact on observed parameter changes (Fig. 4).
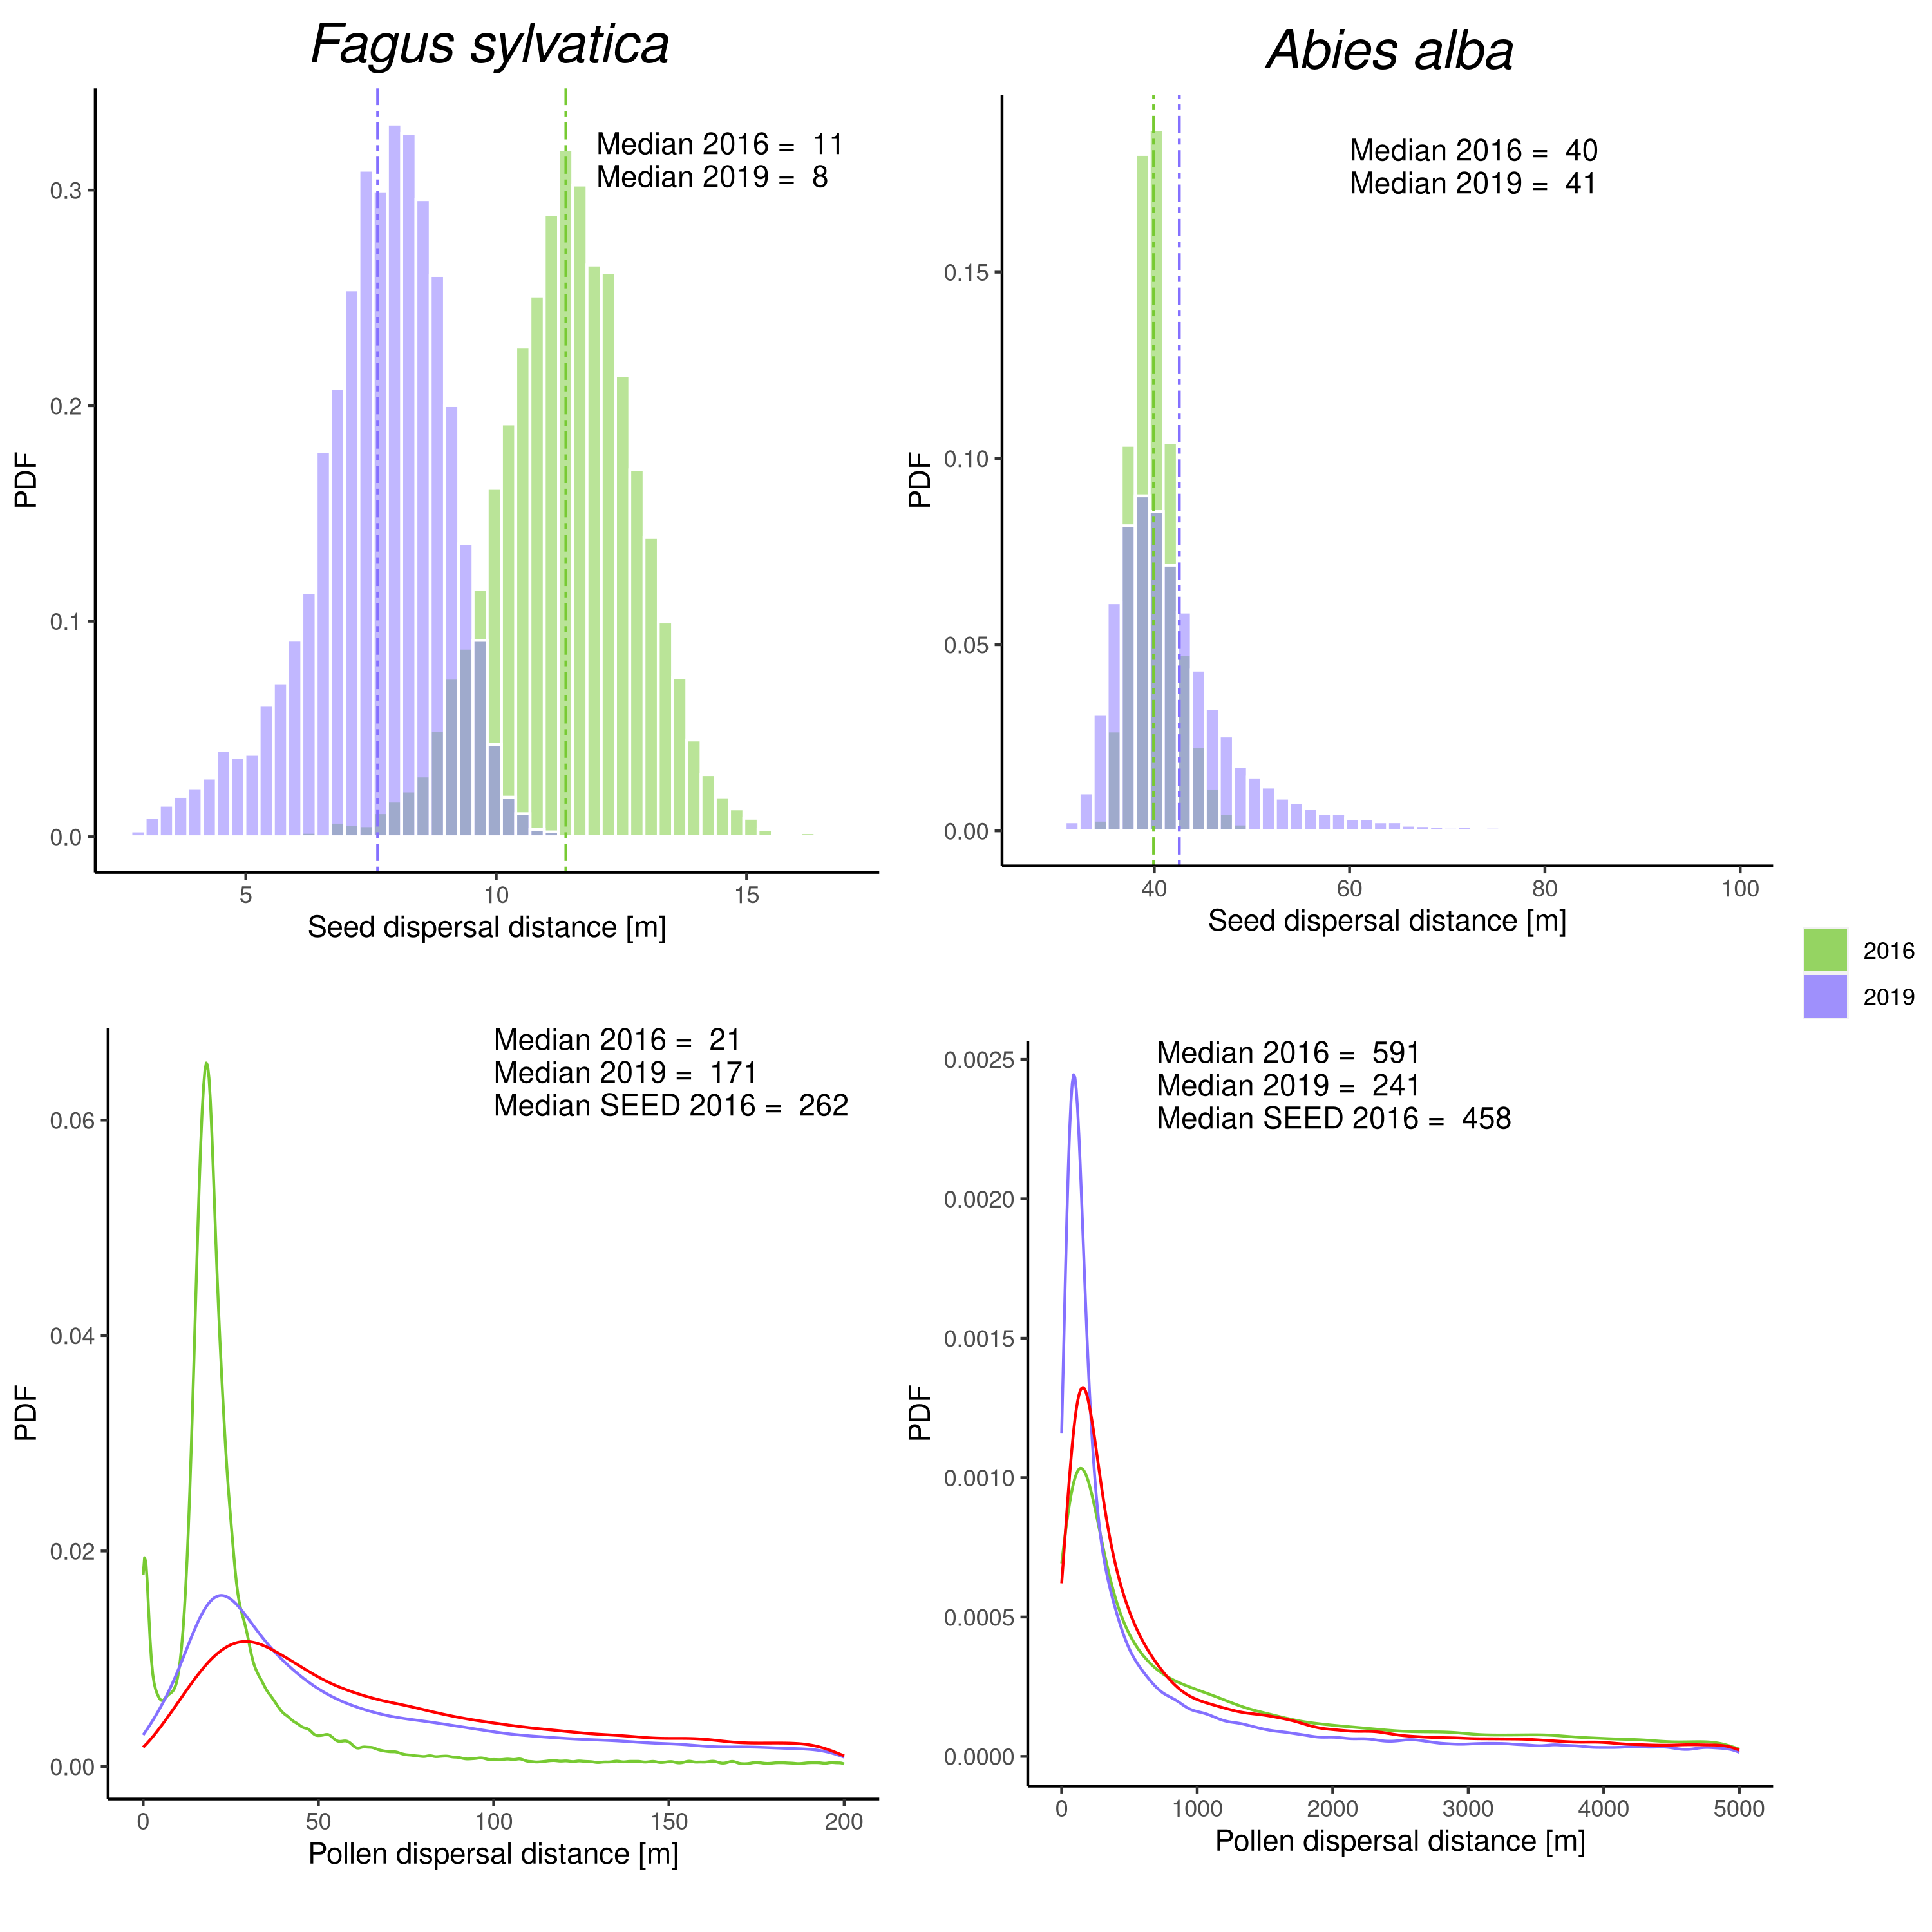
Fig. 3: Seed (above) and pollen (below) dispersal distances [m] and PDF – probability density function for beech (left) and silver fir (right). The dispersal distance from the 2016 seedling model is in green, the dispersal distance from the 2019 seedling model is in blue and seed dispersal distance from the seed model is in red.
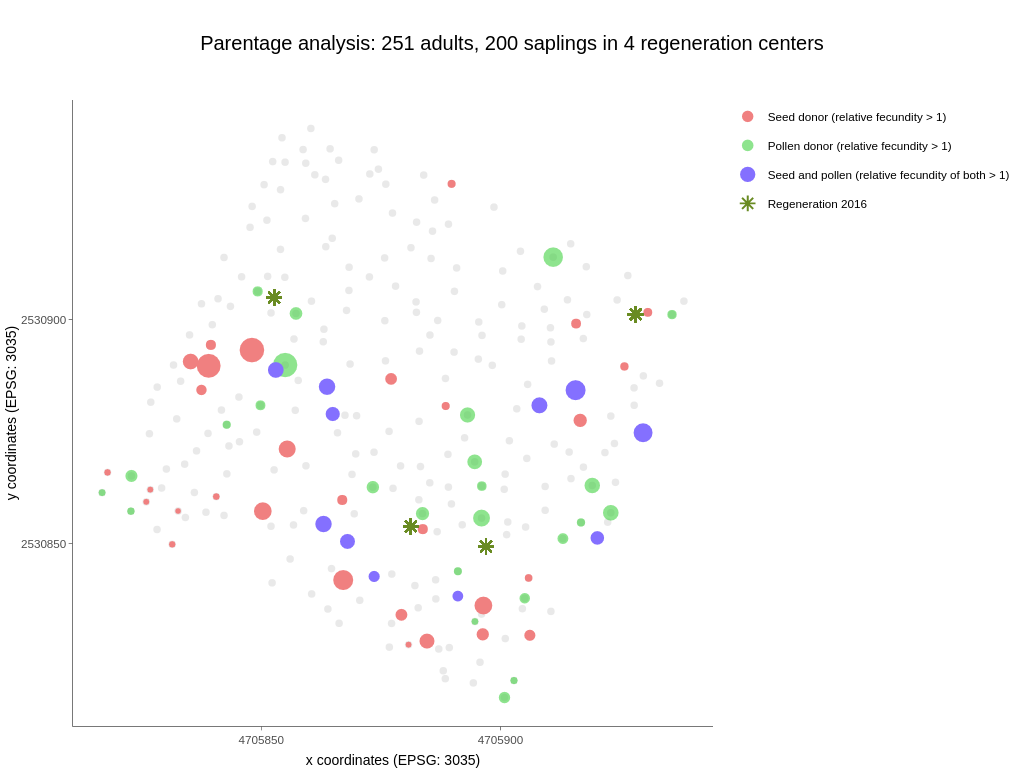
Fig. 4: Adult trees and regeneration centres sampled for Fagus sylvatica in Slovenia. Each adult tree above 15 cm threshold is denoted by a dot, regeneration centres consisting of 50 seedlings each are denoted with a star (*). Coloured trees have a relative fecundity >1; red represents seed donors, green pollen donors and blue trees which were both seed and pollen donors simultaneously. The size of the circle represents relative fecundity.
3. RAW Data Access
Raw data for the project LIFEGENMON can be accessed online with an opensource tool called Calc (Fig. 5), which is part of OpenForis (http://www.openforis.org/). Data can be filtered, downloaded and then analysed using available R / Python 3 scripts / other software.

Fig. 5: Browsing LIFEGENMON data in Calc – an opensource tool developed in OpenForis.
Raw data browsing is available on this link. Access credentials are available upon request on E-Mail.